詳解雅思寫作Task1常出現的兩大問題,希望能幫助到大家,下面小編就和大家分享,來欣賞一下吧。
詳解雅思寫作Task1常出現的兩大問題
雅思寫作Task1需要注意的主語問題
通常我們在Task 1會遇到很多變化類的圖表題,例如表格,柱狀,餅狀圖等。常常需要描述某數據的變化趨勢,以及對比哪些不同,發表一下簡單的預測等。我們可以看下面分析:
WRITING TASK 1 (劍9 Test 4 Task 1)
You should spend about 20 minutes on this task.
The graph below gives information from a 2008 report about consumption of energy in the USA since 1980 with projections until 2030.
Summaries the information by selecting and reporting the main features, and make comparisons where relevant.
Write at least 150 words.

通過上述的圖表可以得知,Petrol and Oil這條線是能夠很輕易的看得出他的變化趨勢即整體上升,雖然在一開始這個數據是存在波動的。于是大多數考生就會寫出下面的語句:
Petrol and oil increase from 1980 to 2030, despite initial fluctuations.
當我們看到這樣的語句時,通常喜歡選擇正確的謂語動詞以及相應的趨勢名詞來進行描述其變化,但是關鍵問題是主語在描述數據變化趨勢時,廣大考生一定要擦亮眼睛,并不是所有的名詞都能夠作為變化趨勢的主語,比如這道題目中上升或者波動的其實并不是汽油和石油,而是它們的消耗量。因此本句應該是這樣的:
The consumption of petrol and oil increases from 1980 to 2030, despite initial fluctuations.
雅思寫作Task1需要注意的謂語動詞正確性的問題
因此我們在做雅思寫作Task1的時候,除了要注意我們常規的語法問題,一定要切記我們的主語問題。這個是很關鍵的。對考題里面的時態沒有進行詳細了解,就直接開始使用時態。通常我們在描述變化趨勢或者數據的升降的時候,一定要注重謂語動詞的正確性。要根據考題里面提供的時態依據作為標準。
以下題為例:
WRITING TASK 1 (劍9 Test 2 Task 1)You should spend about 20 minutes on this task.
The chart below shows the total number of minutes (in billions) of telephone calls in the UK, divided into three categories, from 1995-2002.
Summaries the information by selecting and reporting the main features, and make comparisons where relevant.
Write at least 150 words.

在描述local-fixed line的數據變化趨勢時,一般的考生都能夠看到該數據呈現先上升在下降的變化趨勢,但是在具體書寫時卻往往容易忽視圖表上的時間是從1995年到2002年,因此本來這里描述趨勢的語句應該選用一般過去時。因此,他們會寫出下面的語句:
The figure for local-fixed line increase from 1995 to 1999 before decreasing between 1999 and 2002.
可以看到在雅思寫作Task1的時候,在描寫變化趨勢時,主語用的是很恰當的,可以謂語部分“increase”就出錯了。沒有考慮到圖表的時間是發生在過去應該用“increase”的一般過去時的形式“increased”。所以上面的句子應該改為:
The figure for local-fixed line increased from 1995 to 1999 before decreasing between 1999 and 2002.
小作文提分丨如何做好雅思圖表作文題目審題
雅思圖表作文題目審題step 1:關注寫作時態
時態是一個簡單易錯的語法點,之所以放到審題的第一步,就是我們發現在大家的寫作過程中,時態不出錯的寥寥無幾。小作文做為數據說明文,首先強調的就是準確度,時態對于數據描述的準確性毋庸置疑,對于時態的處理要根據每個題目提供的時間信息靈活處理。
1)提供的時間為過去的時間,要用過去時
2)沒有給出明確的時間信息,可以使用一般現在時
3)給出的時間有過去、現在、獎勵啊,需要具體問題具體分析
雅思圖表作文題目審題step 2:數據分類
對數據合理分類是考察數據分析能力的一個重要方面。在數據類圖表的分析中,一道題目可以從多個角度進行分類,但是合理的分類標準往往從數據特征出發,比如按照數據的變化趨勢或數據的高低來分類,有時也會按照題目的既定分類來組織。
雅思圖表作文題目審題step 3:數據對比分析
對比是數據類作文中最核心的描述內容之一。下面簡單給大家總結幾點:
1. 從屬連詞對比數值 35% of British people went abroad, while/whereas/although 28% of Australians spent holidays in a different country.
2. 狀語從句省略句式,不可寫做comparing 35% of British people went abroad, compared to/with 28% of Australians.
3. 一句話排序句式Heating room accounts for the largest proportion of household energy use, followed by heating water (30%), and then other appliances (15%).
4. 數值相等:The figures for America and China were similar/equal at 100 tons in 1999.
雅思圖表作文題目審題step 4:描述變化趨勢
對于變化趨勢的描述是數據類圖表核心描述之一,尤其是對于動態變化類的圖表。描述變化趨勢的基本要求是準確性與多樣性。
首選是詞匯層次。除了要準確的使用詞匯來描述上升與下降之外,變化的幅度(degree)也要描述準確。
其次是描述變化趨勢的句式。
雅思圖表作文題目審題step 5:點睛總結
綜述是數據類寫作的點睛之筆,是考官在判斷一篇文章能否拿到7分的重要衡量標準。在數據分析中,如果能夠對于變化趨勢以及對比清晰地綜述(presents a clear overview of main trends, differences or stages),就有機會在評分標準Task achievement任務回應方面拿到7分。
綜述的內容為對于數據信息進行概括,把最主要的變化趨勢或數據對比總結為一句或兩句話,所以不同類型的題目側重點不同,要具體問題具體分析。
補充一些在雅思圖表作文寫作中考生比較容易犯錯的表達:
had a decrease/ increase:沒有這樣的表達,一般是saw a decrease/increase
Increased, decreased, declined 這些上升和下降的詞都沒有被動語態
當the number, the amount, the figure, the proportion做句子的主語的時候,不能用account for
The amount不能替換the number
remained 后面只能加形容詞,也就是“remain constantly”是錯的,只有“remain constant”
在動態圖里,一般是rose “數字”-fold,譬如說是”rose fivefold”而不是“rose five times”
Doubled(增長一倍)不及物動詞,沒有被動
“millions” 或者“thousands”在句子中出現時不能加復數,只有“數字+million or thousand”的說法
動態圖過分注重數據和小的波動,而忽視趨勢。趨勢是一個區間內最主要的一個變化
靜態圖過分側重讀數據,沒有將數據歸類和歸納(具備類似特征的數據要放在一起)
圖表作文最好不要出現in addition, moreover這些連接詞
Followed by后面要寫名詞,而且這個名詞要和主句的主語性質差不多
Reach 讀數據的時候不能加to或者at, 直接加數據就可以
Ratio和rate一般不能替代proportion和percentage
Picture 不能替換graph 或者chart
不要用定語從句讀數據,譬如說 the crime rate in the US was highest, which was 0.3%. 這里的which was 直接省略。
說人年齡的時候應該是aged,譬如說people aged from 15 to 24
一般不會用過去進行時態,也就是was increasing/decreasing 是錯的
While, whereas一定要連接兩個獨立的句子,不能夠單獨存在
副詞slightly不能修飾名詞,應該是slight increase, drop
小作文一般用不到minimum這個詞,minimal的意思不是“最小的”,而是“基本上可以忽略不計的”
盡量不要用套句,如果用,要注意不要寫錯,it is worth noting that, it should be noted that
圖表作文一般用不到on the contrary, 用in contrast, by contrast即可
表示波動可以說fluctuated,不要寫saw a fluctuation
Reduce和raise這兩個詞小作文用不到,因為是及物動詞;arise也不能替代
rise;“ascent/descent”不能用在小作文里。
結尾段不能寫數據
小作文指南丨雅思圖表作文范文匯總
雅思圖表作文之:線性圖
雅思圖表作文主題:企業垃圾
The graph below shows the amounts of waste produced by three companies over a period of 15 years.

(本圖來自于劍雅真題)
雅思圖表作文范文
The line graph compares three companies in terms of their waste output between the years 2000 and 2015.
這條線圖對三家公司的廢物產出從2000年到2015年進行了比較。
It is clear that there were significant changes in the amounts of waste produced by all three companies shown on the graph. While companies A and B saw waste output fall over the 15-year period, the amount of waste produced by company C increased considerably.
很明顯,圖表上顯示的這三家公司生產的垃圾量發生了重大變化。雖然A公司和B公司在15年的時間里看到了廢物的產量下降,但C公司生產的廢物量卻大幅增加。
In 2000, company A produced 12 tonnes of waste, while companies B and C produced around 8 tonnes and 4 tonnes of waste material respectively. Over the following 5 years, the waste output of companies B and C rose by around 2 tonnes, but the figure for company A fell by approximately 1 tonne.
2000年,A公司生產了12噸廢物,而B公司和C公司分別生產了大約8噸和4噸廢料。在接下來的5年里,公司B和C的廢料產量增加了大約2噸,但是公司A的產量下降了大約1噸。
From 2005 to 2015, company A cut waste production by roughly 3 tonnes, and company B reduced its waste by around 7 tonnes. By contrast, company C saw an increase in waste production of approximately 4 tonnes over the same 10-year period. By 2015, company C’s waste output had risen to 10 tonnes, while the respective amounts of waste from companies A and B had dropped to 8 tonnes and only 3 tonnes.(192 words, band 9)
從2005年到2015年,公司將廢物產量減少了大約3噸,公司B減少了大約7噸的垃圾。相比之下,C公司在同樣的10年時間里,廢物產量增加了大約4噸。到2015年,C公司的廢物產量已升至10噸,而A和B公司的垃圾量已降至8噸,僅為3噸。
雅思圖表作文之餅圖
雅思圖表作文主題:游客分析
The chart below shows the results of a survey of people who visited four types of tourist attraction in Britain in the year 1999.

(本圖來自于劍雅真題)
雅思圖表作文范文
The pie chart compares figures for visitors to four categories of tourist attraction and to five different theme parks in Britain in 1999.
這個餅狀圖比較了1999年英國的四類旅游景點和5個不同主題公園的游客人數。
It is clear that theme parks and museums / galleries were the two most popular types of tourist attraction in that year. Blackpool Pleasure Beach received by far the highest proportion of visitors in the theme park sector.
很明顯,主題公園和博物館/畫廊是那一年最受歡迎的兩種旅游景點。在主題公園中,黑潭快樂海灘獲得的游客比例是最高的。
Looking at the information in more detail, we can see that 38% of the surveyed visitors went to a theme park, and 37% of them went to a museum or gallery. By contrast, historic houses and monuments were visited by only 16% of the sample, while wildlife parks and zoos were the least popular of the four types of tourist attraction, with only 9% of visitors.
更詳細地看這些信息,我們可以看到,38%的受訪游客去了一個主題公園,其中37%的人去了博物館或美術館。相比之下,只有16%的樣本參觀了歷史建筑和紀念碑,而野生動物公園和動物園則是這四種旅游景點中最不受歡迎的,只有9%的游客。
In the theme park sector, almost half of the people surveyed (47%) had been to Blackpool Pleasure Beach. Alton Towers was the second most popular amusement park, with 17% of the sample, followed by Pleasureland in Southport, with 16%. Finally, Chessington World of Adventures and Legoland Windsor had each welcomed 10% of the surveyed visitors.(181 words, band 9)
在主題公園領域,幾乎一半的被調查者(47%)曾經到過布萊克浦的快樂海灘。奧爾頓塔是第二大最受歡迎的游樂園,有17%的樣本,其次是在索斯波特的娛樂公園,占16%。最后,查辛頓冒險世界和樂高和溫莎的游客都歡迎10%的游客。
雅思圖表作文之餅圖
雅思圖表作文主題:各地房價
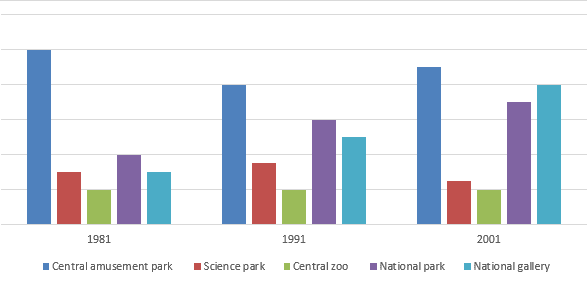
The chart below shows information about changes in average house prices in five different cities between 1990 and 2002 compared with the average house prices in 1989.

(本圖來自于劍雅真題)
雅思圖表作文范文:
The bar chart compares the cost of an average house in five major cities over a period of 13 years from 1989.
柱狀圖比較了從1989年開始的13年里,五個主要城市的平均房價。
We can see that house prices fell overall between 1990 and 1995, but most of the cities saw rising prices between 1996 and 2002. London experienced by far the greatest changes in house prices over the 13-year period.
我們可以看到,在1990年至1995年期間,房價總體下跌,但大多數城市在1996年至2002年期間房價上漲。在過去的13年里,倫敦經歷了房價的最大變化。
Over the 5 years after 1989, the cost of average homes in Tokyo and London dropped by around 7%, while New York house prices went down by 5%. By contrast, prices rose by approximately 2% in both Madrid and Frankfurt.
在1989年之后的5年里,東京和倫敦的平均房價下跌了7%,而紐約房價下跌了5個百分點。相比之下,馬德里和法蘭克福的房價都上漲了大約2個百分點。
Between 1996 and 2002, London house prices jumped to around 12% above the 1989 average. Homebuyers in New York also had to pay significantly more, with prices rising to 5% above the 1989 average, but homes in Tokyo remained cheaper than they were in 1989. The cost of an average home in Madrid rose by a further 2%, while prices in Frankfurt remained stable.(165 words)
從1996年到2002年,倫敦房價跳漲到比1989年平均水平高出12個百分點。紐約的購房者也不得不支付更高的價格,房價比1989年的平均水平高出5%,但東京的房價仍然低于1989年的水平。在馬德里,平均房價上漲了2%,而法蘭克福的房價則保持穩定。
雅思圖表作文之表格
雅思圖表作文主題:騎車上班
The table below shows changes in the numbers of residents cycling to work in different areas of the UK between 2001 and 2011.

(本圖來自于劍雅真題)
雅思圖表作文范文
The table compares the numbers of people who cycled to work in twelve areas of the UK in the years 2001 and 2011.
這張表格比較了2001年和2011年在英國12個地區騎車上班的人的數量。
Overall, the number of UK commuters who travelled to work by bicycle rose considerably over the 10-year period. Inner London had by far the highest number of cycling commuters in both years.
總的來說,在過去的10年里,騎自行車上班的英國上班族的數量大幅增加。在這兩年中,倫敦市中心的自行車上班族數量是最多的。
In 2001, well over 43 thousand residents of inner London commuted by bicycle, and this figure rose to more than 106 thousand in 2011, an increase of 144%. By contrast, although outer London had the second highest number of cycling commuters in each year, the percentage change, at only 45%, was the lowest of the twelve areas shown in the table.
2001年,倫敦市中心有超過43萬居民騎自行車上下班,2011年這個數字上升到超過106萬,增長了144%。相比之下,盡管倫敦的自行車上班族每年的出行次數是第二高的,但這個百分比的變化,只有45%,是表中所顯示的12個區域中最低的。
Brighton and Hove saw the second biggest increase (109%) in the number of residents cycling to work, but Bristol was the UK’s second city in terms of total numbers of cycling commuters, with 8,108 in 2001 and 15,768 in 2011. Figures for the other eight areas were below the 10 thousand mark in both years.(172 words, band 9)
布萊頓和霍夫在騎車上班的人數中排名第二(109%),但在自行車上班族的總數中,布里斯托爾是英國的第二大城市,2001年為8108人,2011年為15768人。其他8個地區的數據在這兩年內都低于10萬。
雅思圖表作文之混合圖
雅思圖表作文主題:水消耗
The graph and table below give information about water use worldwide and water consumption in two different countries.

(本圖來自于劍雅真題)
雅思圖表作文范文:
The charts compare the amount of water used for agriculture, industry and homes around the world, and water use in Brazil and the Democratic Republic of Congo.
這些圖表比較了世界各地的農業、工業和家庭用水的數量,以及巴西和剛果民主共和國的用水情況。
It is clear that global water needs rose significantly between 1900 and 2000, and that agriculture accounted for the largest proportion of water used. We can also see that water consumption was considerably higher in Brazil than in the Congo.
顯然,在1900年至2000年期間,全球的水需求顯著增加,農業用水占用水的比例最大。我們還可以看到,巴西的用水量比剛果要高得多。
In 1900, around 500km3 of water was used by the agriculture sector worldwide. The figures for industrial and domestic water consumption stood at around one fifth of that amount. By 2000, global water use for agriculture had increased to around 3000km3, industrial water use had risen to just under half that amount, and domestic consumption had reached approximately 500km3.
1900年,全世界的農業部門使用了大約500公里的水。工業和家庭用水的數字大約是這一數字的五分之一。到2000年,全球用于農業的用水量增加到約3000公里,工業用水已增加到不足一半,國內消費已達到約500公里。
In the year 2000, the populations of Brazil and the Congo were 176 million and 5.2 million respectively. Water consumption per person in Brazil, at 359m3, was much higher than that in the Congo, at only 8m3, and this could be explained by the fact that Brazil had 265 times more irrigated land.(184 words, band 9)
在2000年,巴西和剛果的人口分別為1.76億和520萬。巴西人均用水量為3.59億,比剛果的人均用水量要高得多,僅為800萬,這可以解釋為巴西的灌溉面積是265倍。
詳解雅思寫作Task1常出現的兩大問題相關文章:
★ 雅思口語如何用詞匯凸顯亮點
上一篇:雅思成績如何復議
下一篇:雅思寫作如何避免非正式表達